Decoding the VIX Curve: Your Essential Guide to Market Volatility and Risk Management
Have you ever wondered what truly drives the ups and downs of the stock market, or how professional traders anticipate moments of fear and calm? While the daily headlines often focus on the S&P 500’s movements, a more subtle yet powerful indicator exists: the Cboe Volatility Index (VIX), often dubbed Wall Street’s “fear gauge.” But the VIX index alone tells only part of the story. A deeper understanding of market sentiment and future expectations lies within the VIX futures curve – its unique shape, whether in contango or backwardation, provides critical signals for traders and investors like you. This article will demystify the VIX, explore the nuances of its futures curve, and outline actionable insights for navigating periods of market calm and turmoil.
We’ll start by breaking down the VIX itself, understanding its origins and what it truly measures. Then, we’ll dive into the fascinating world of the VIX futures curve, explaining the common state of contango and the rare, but potent, warning sign of backwardation. We’ll even look at a real-world example to see how the curve reacts to major events. Finally, we’ll discuss how market participants use VIX derivatives, like futures and options, to manage risk and potentially capitalize on volatility shifts. Our goal is to equip you with the knowledge to better interpret market signals and make more informed decisions.
The VIX Explained: More Than Just a Number
At its core, the VIX is the Cboe Volatility Index, and it serves as the market’s primary barometer for anticipated S&P 500 volatility over the next 30 days. Think of it as a real-time measure of how much investors expect the stock market to swing up or down in the near future. It’s calculated from the prices of S&P 500 index options, specifically using a wide range of put and call options with various strike prices and expiration dates. When investors are worried about the market falling, they tend to buy more protective put options, which drives up their prices, and in turn, pushes the VIX higher.
Here are some key aspects of the VIX calculation:
- The VIX is a forward-looking measure, anticipating volatility over the next 30 calendar days.
- It aggregates weighted prices of S&P 500 options with more than 23 days and less than 37 days to expiration.
- The calculation involves a complex formula that sums up the variance contributions of out-of-the-money options.
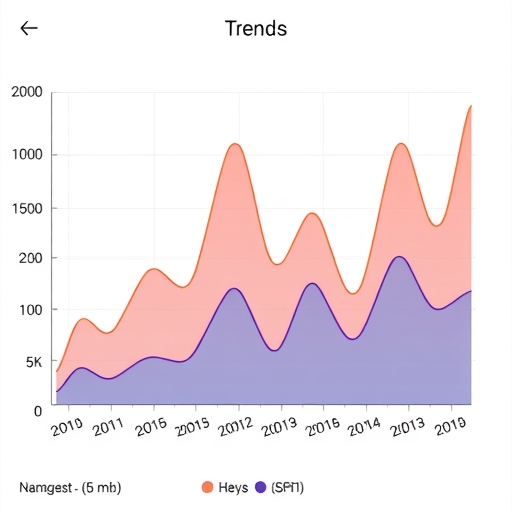
So, what does a VIX value tell us? Generally, a VIX value around 15 or lower signals low market volatility and a relatively calm period. When the VIX jumps to 30 or higher, it indicates significant fear and heightened expectations of market turbulence. Historically, the VIX tends to hover in the teens during stable economic times. However, external shocks, such as major financial crises or unexpected geopolitical events, can send the VIX soaring to extreme levels – for instance, it surged above 80 during both the 2008 financial crisis and the 2020 COVID-19 market panic. It’s important to remember that the VIX itself is an index; you cannot directly trade it. Instead, investors use VIX futures and options to gain exposure to anticipated volatility.
| VIX Value Range | Market Interpretation | Typical Market Conditions |
|---|---|---|
| Below 12 | Very Low Volatility | Periods of extreme complacency or strong bull markets. |
| 12 – 20 | Normal/Moderate Volatility | Typical market environment, healthy economic times. |
| 20 – 30 | Elevated Volatility | Increased uncertainty, minor corrections, or pre-event jitters. |
| Above 30 | High Volatility/Fear | Significant market downturns, crises, or major geopolitical shocks. |
One of the most interesting characteristics of the VIX is its tendency for mean reversion. This means that after a sharp spike, the VIX often reverts back towards its historical average range (typically 10-15) as market fear subsides. This behavior is crucial for understanding how VIX derivatives are priced and traded. We also observe a strong inverse relationship: the VIX generally rises sharply when the S&P 500 falls, and it tends to fall when the S&P 500 rises. Rapid drops in the S&P 500, in particular, are often accompanied by significant increases in the VIX, reflecting sudden heightened anxiety among market participants.
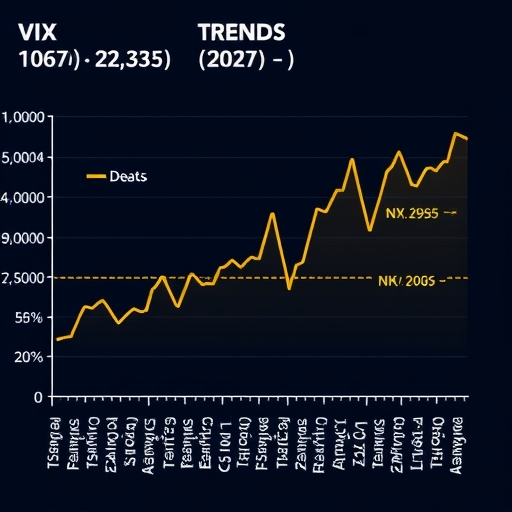
Unveiling the VIX Futures Curve: Contango vs. Backwardation
While the spot VIX gives us a snapshot of current market expectations for volatility over the next 30 days, the VIX futures curve (also known as the term structure) provides a more comprehensive view. This curve is simply a collection of VIX futures prices across various expiration dates – typically for the next seven to eight months. By looking at the prices of these futures contracts, we can see how the market expects volatility to evolve over time, offering a forward-looking perspective beyond the immediate 30-day window.
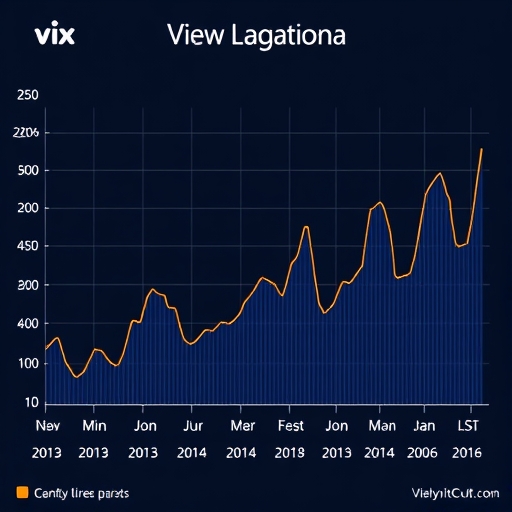
There are two primary shapes the VIX futures curve can take, and each tells a very different story about market sentiment:
-
Contango (Normal State): This is the most common state for the VIX futures curve. In contango, the curve is upward-sloping, meaning that near-term VIX futures contracts are cheaper than longer-dated futures. For example, a future expiring next month might be priced at 18, while a future expiring six months from now might be at 22. This shape signals that the market expects volatility to be relatively calm in the immediate future but anticipates higher volatility in the distant future. Why is this considered “normal”? It’s often attributed to the Volatility Risk Premium (VRP). Investors are generally willing to pay a premium for protection against future volatility, especially for longer time horizons, because unexpected events can always occur. For those who sell volatility, contango can create a “roll yield” as futures prices tend to drift down towards the spot VIX as they approach expiration, offering a potential source of profit.
-
Backwardation (Inverted State): This is a rarer and far more significant state for the VIX futures curve. In backwardation, the curve is downward-sloping, meaning that near-term VIX futures contracts are more expensive than longer-term futures. For instance, a future expiring next month might be at 25, while a future six months out might be at 20. This inverted shape signals acute near-term market stress and high immediate fear. Traders are essentially anticipating more risk right now, with expectations that conditions will calm down later. Backwardation is typically short-lived, often lasting only days or weeks, and frequently coincides with market bottoms or periods of peak fear during a correction or downturn. It serves as a clear warning sign that stormy weather is in the immediate forecast.
Understanding the difference between contango and backwardation is crucial because it provides insight into the market’s collective anxieties and expectations. While contango suggests a relatively benign outlook, backwardation warns of immediate trouble, compelling investors to re-evaluate their positions and strategies.
| Curve Shape | Description | Market Sentiment | Implication |
|---|---|---|---|
| Contango (Normal) | Near-term futures < Longer-term futures (Upward-sloping) | Calm, expectation of future volatility premium (VRP) | Typical market condition; generally benign outlook. |
| Backwardation (Inverted) | Near-term futures > Longer-term futures (Downward-sloping) | Acute near-term fear, immediate stress | Warning sign; often precedes or accompanies market downturns. |
When the Curve Inverts: A Warning Sign for Investors
An inverted VIX futures curve, or backwardation, is not just a theoretical concept; it’s a powerful and actionable signal that demands attention from investors. When the near-term futures are more expensive than those further out, it tells us that the market is acutely worried about what’s coming in the next few weeks. This isn’t just a slight bump; it’s often a sign of significant, immediate downside risk.
Consider the example of the March 2018 Trade War scare. In March 2018, when the U.S. announced sudden tariffs on steel and aluminum, global trade war fears erupted. The VIX index itself spiked significantly (e.g., to 24.87), but more importantly, the VIX futures curve sharply inverted. Near-term futures contracts immediately became more expensive than their longer-dated counterparts. This demonstrated how unexpected policy surprises can quickly jolt the volatility term structure and create a sudden, intense demand for short-term hedging. Investors were bracing for immediate fallout from potential trade disputes, even if they expected the long-term impact to be less severe. While volatility spikes driven by news can fade quickly if the worst fears don’t materialize, with the curve reverting to contango, the initial inversion clearly indicated immediate concern.
So, what should you do as a trader or investor when you see the VIX futures curve in backwardation? It’s a “danger ahead” signal, prompting a defensive posture. Here are some actions market participants typically consider:
- Reassess Portfolio Exposure: Take a hard look at your current holdings. Are you overexposed to risky assets? An inverted curve suggests it might be time to trim or hedge vulnerable positions.
- Stress-Test Allocations: Imagine your portfolio under elevated turbulence. Can it withstand a significant downturn? This is a good time to ensure your asset allocation is robust.
- Hedge Downside: Proactive hedging becomes paramount. This could involve buying protective put options on your stocks or the broader market (like S&P 500 index puts), increasing your cash holdings, or even using volatility instruments like VIX futures to offset potential losses.
- Focus on Risk Management: Above all, prioritize risk management. An inverted curve is not the time to be chasing speculative gains; it’s the time to protect what you have and ensure you can weather the storm.
While backwardation is often short-lived, its recurrence or persistence in waves during prolonged bear markets reflects sustained uncertainty and acts as a continuous reminder of elevated risk. Recognizing this signal can help you avoid being blindsided by sudden market downturns.
Strategic Moves: Trading Opportunities and Risk Management with VIX Derivatives
Since the VIX index itself cannot be directly traded, investors and traders use VIX futures and VIX options to gain exposure to anticipated market volatility. These derivatives allow market participants to translate their insights from the VIX curve into actionable strategies, whether for speculation or, more commonly, for hedging portfolios against market downturns.
VIX Futures: A Forward Look at Volatility
VIX futures allow you to lock in volatility expectations for future months. Unlike traditional commodity futures, they are cash-settled, meaning there’s no physical delivery of an asset. Their pricing isn’t tied by the usual “cost of carry” relationship because the VIX is not a tradable asset that can be stored or borrowed. Instead, VIX futures are priced statistically, influenced by factors like the VIX’s historical distribution, trend strength, and its famous mean-reverting tendency. The correlation between VIX futures and the spot VIX index can vary, especially as they approach expiration. A key aspect of trading VIX futures is understanding roll costs, as the front-month contract is often cheaper than the second month, reflecting the contango structure.
The VIX futures term structure offers distinct trading opportunities:
- Selling VIX Futures in Contango: This is a common strategy for those who believe volatility will remain low or revert to its mean. In a contango environment, longer-dated futures are more expensive, and selling them can be profitable as they tend to decay towards the spot VIX near expiration. The CBOE SHORTVOL Index, for example, tracks a strategy of rolling short VIX futures. While potentially profitable long-term, this strategy carries significant risk and can lead to large drawdowns during sharp market downturns. It can be optimized by closing positions when backwardation occurs.
- Buying VIX Futures in Backwardation: This strategy is for those who believe current market stress will continue or worsen in the short term. When the curve is inverted, near-term futures are more expensive, and buying them can be profitable if volatility remains high or spikes further. The CBOE LONGVOL Index tracks a similar strategy, but it requires precise timing, as backwardation is often short-lived.
- Selling VIX Futures at or near VIX Peaks: Capitalizes on the VIX’s mean-reversion tendency after a sharp spike. If the VIX has surged, there’s a good chance it will eventually come back down, making shorting VIX futures attractive.
- Buying VIX Futures at or near VIX Bottoms: Conversely, if the VIX is extremely low, there’s potential for a sharp rise, even if the curve is still in contango. This strategy aims to profit from sudden increases in fear.
When considering VIX futures trading, it’s essential to account for:
- Roll Yield: The continuous process of closing expiring contracts and opening new ones, which is a significant factor due to contango.
- Leverage: Futures contracts are highly leveraged instruments, amplifying both gains and losses.
- Liquidity: While front-month VIX futures are liquid, further-dated contracts can have wider bid-ask spreads.
It’s also important to note the performance of Exchange Traded Products (ETPs) that track the VIX, such as popular ETFs and ETNs like VXX, UVXY, VXZ, XXV, VIXS, and VSXX. These products aim to provide exposure to VIX futures, but they often have a low correlation with the VIX index itself over the long term. This is primarily due to the constant rolling of futures contracts, where the persistent contango in the VIX curve tends to erode their value over time, making them unsuitable for long-term buy-and-hold strategies unless backwardation is sustained.
| ETP Ticker (Example) | Type | Description | Key Characteristic/Risk |
|---|---|---|---|
| VXX (iPath Series B S&P 500 VIX Short-Term Futures ETN) | ETN | Tracks a short-term VIX futures index (first two months). | Significant contango drag; typically loses value over time. |
| UVXY (ProShares Ultra VIX Short-Term Futures ETF) | ETF | Provides 1.5x leveraged exposure to short-term VIX futures. | Extreme sensitivity to contango; very high decay rate. |
| VXZ (iPath Series B S&P 500 VIX Mid-Term Futures ETN) | ETN | Tracks mid-term VIX futures index (fourth to seventh months). | Less contango drag than short-term, but still present. |
The Unique World of VIX Options: Challenges and Advantages
While VIX futures provide direct exposure to future volatility expectations, VIX options offer a more nuanced way to express views on volatility or to hedge a portfolio. However, VIX options have several peculiarities that set them apart from traditional equity options, making them quite challenging for many investors.
First and foremost, VIX options are derived from VIX futures, not the VIX index itself. This means their pricing is directly based on the underlying VIX futures contracts. They have a multiplier of 100, are European exercise (meaning they can only be exercised at expiration), and are cash-settled. This connection to futures is critical for understanding their behavior.
One of the biggest challenges with VIX options is their extremely high implied volatility. Even when the VIX index is at a moderate level (e.g., 21), the implied volatility of VIX options can be as high as 70-80%. This makes them very expensive to buy. Why so high? Because the VIX itself is highly volatile, and the market builds in a significant premium for the potential for massive, rapid swings.
The concept of mean-reversion also heavily influences VIX option pricing. When the VIX is high, the market anticipates it will eventually fall, making VIX put options expensive. Conversely, when the VIX is low, the market anticipates it will eventually rise, making VIX call options pricey. This means that buying options when the VIX is at extremes can be particularly costly. Despite these challenges, put-call parity holds for VIX options, with the VIX futures contract acting as the underlying.
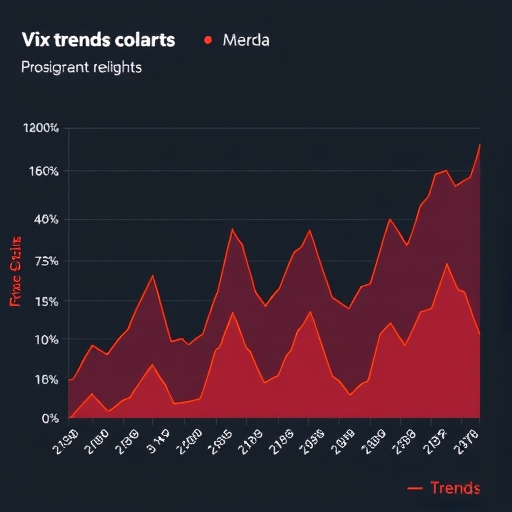
Other unique characteristics include:
- The implied volatility of VIX options tends to decrease with time to expiration, resulting in a downward-sloping term structure of volatility for the options themselves.
- The theta (time decay) of VIX options is often smaller than that of equity options. This is counterintuitive but stems from the fact that as VIX options approach expiration, their implied volatility can actually increase, especially if market uncertainty persists.
- Calendar spreads on VIX options can sometimes trade for a credit due to the VIX futures term structure, offering unique strategic possibilities.
- There is a steep call skew in VIX options. This means that out-of-the-money call options are significantly more expensive than out-of-the-money put options. This is largely due to strong institutional hedging demand for upside protection against sudden VIX spikes, as the VIX tends to spike up more often and more dramatically than it falls.
While VIX options can be incredibly powerful tools for hedging and diversification, their complex pricing, high cost, and unique behavior demand a deep understanding and careful risk management. They are not for the faint of heart, but for sophisticated investors, they offer unparalleled flexibility in managing volatility exposure.
Conclusion
The VIX index and its futures curve offer an invaluable toolkit for deciphering market sentiment and anticipating future volatility. We’ve seen how the VIX serves as Wall Street’s “fear gauge,” reflecting expected S&P 500 volatility, and how it exhibits a strong tendency to revert to its mean after spikes. But the true depth of market expectation is revealed in the VIX futures curve.
Understanding the common state of contango, which signals relative calm and a volatility risk premium, is crucial for long-term perspectives. Equally important is recognizing the urgent warning of backwardation, an inverted curve that signifies acute near-term market stress, often coinciding with peak fear and potential market bottoms. We discussed how events like the 2018 trade war demonstrated the immediate implications of such an inversion, prompting investors to reassess their portfolios and strengthen their hedging strategies.
Furthermore, we explored the mechanics of VIX futures and options, recognizing their unique pricing dynamics, high implied volatility, and the challenges they present. While VIX-tracking ETPs might seem like an easy way to gain exposure, their performance is heavily influenced by the contango in the futures curve, often leading to value erosion. By integrating VIX analysis into your portfolio management and employing strategic hedging with derivatives, you can empower yourself to make more informed decisions and better navigate the inherent uncertainties of financial markets, transforming potential blindsides into prepared responses.
Disclaimer: This article is intended for informational and educational purposes only and does not constitute financial advice. Investing in financial markets, including VIX derivatives, carries inherent risks, and you could lose money. Always consult with a qualified financial professional before making any investment decisions.
Frequently Asked Questions (FAQ)
Q: What is the primary purpose of the VIX index?
A: The VIX index serves as Wall Street’s “fear gauge,” measuring the market’s expectation of S&P 500 volatility over the next 30 days. A higher VIX typically indicates greater anticipated market turbulence and fear among investors.
Q: How do Contango and Backwardation differ in the VIX futures curve?
A: Contango is the normal state where longer-dated VIX futures are more expensive than near-term ones, suggesting a calm outlook with an expected volatility risk premium. Backwardation is a rarer, inverted state where near-term futures are more expensive, signaling acute immediate market stress and fear.
Q: Can I directly trade the VIX index?
A: No, the VIX is an index and cannot be directly traded. Investors gain exposure to anticipated volatility by trading VIX derivatives, such as VIX futures and VIX options, which are based on the VIX futures curve.


No responses yet